Business Context
Nobody announced the shift. There was no memo, no migration project, no vendor pitch that landed it. But across enterprise after enterprise, the same pattern is emerging: users are asking their questions somewhere other than the dashboard. They're typing into Copilot sidebars, Genie chat windows, Slack-integrated data agents. The BI tool is still running. It's still licensed. It's just no longer the first place people go when they need an answer. That distinction matters more than most BI leaders realise.
The Problem: The Interface Is Shifting Under Your Feet
Here's what I keep seeing. A finance team has a perfectly good Power BI report for monthly variance analysis. Twelve tabs, drill-throughs, slicers, the works. Took three months to build. But last quarter, half the team started asking their variance questions to a Microsoft Fabric data agent instead. Not because the dashboard was wrong. Because typing "why did OPEX spike in March for the Nordic region" is faster than navigating to the right tab, setting three slicers, and interpreting a waterfall chart.
The dashboard answered the questions it was designed for. The chat surface answers the question the user actually has. That gap -- between designed questions and actual questions -- is where the bypass happens.
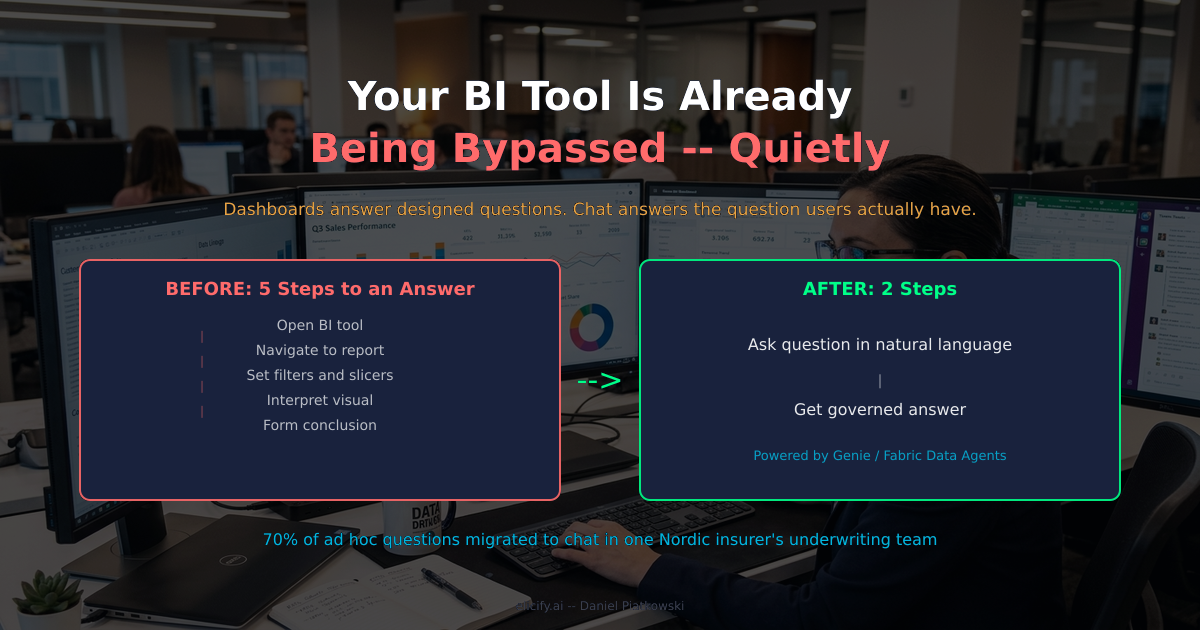
This isn't a BI failure. It's a process shift. The workflow for getting insight used to be: open tool, navigate to report, set filters, interpret visual, form conclusion. Now it's: ask question, get answer. The five-step process collapsed into two. And that collapse is happening whether BI teams plan for it or not.
The uncomfortable part: most BI teams don't have visibility into this bypass. Usage metrics track dashboard views, not the questions people didn't ask there. The dashboards look healthy by every internal metric while the actual decision-making workflow routes around them.
The Solution: Decision Intelligence via Governed Natural Language
Think about what happened in retail when self-checkout arrived. The prediction was simple: fewer cashiers. The reality was different. Self-checkout didn't eliminate cashiers -- it changed what cashiers do. The ones who remained stopped scanning items and started handling exceptions, resolving disputes, managing the floor, and overseeing six machines at once. The routine transaction moved to a new interface. The judgment and governance stayed human.
BI is going through the same transition. The routine question -- "what were last month's numbers?" -- moves to a chat interface. The governance, the definitions, the quality assurance -- that stays with the BI team. Except now the BI team's job looks fundamentally different.
The new architecture has three layers:
Governed semantics as the foundation. This is where the real work lives. Databricks metric views let you define business metrics -- revenue, churn, utilisation -- as governed objects in Unity Catalog. When a user asks Genie "what's our Q1 retention rate?", the agent doesn't invent a calculation. It pulls the governed definition. The metric view is the single source of truth, regardless of whether the question arrives via a dashboard, a chat window, or an agent pipeline.
Natural language as the exploration interface. Dashboards remain the right interface for monitoring -- the daily operational views, the executive scorecards, the alerts. But exploration -- the ad hoc "why did this happen" and "what if we changed that" questions -- increasingly flows through natural language. Databricks Genie and Microsoft Fabric data agents both follow this pattern: the user asks in plain language, the system generates a governed query, and returns a direct answer.
Audit and oversight as the human layer. Every query generated by a chat surface needs to be auditable. What metric definition did it use? What filters did it apply? Did it interpret the question correctly? This is where BI professionals add value that no chat interface replaces.
%%{init: {'theme': 'base', 'themeVariables': {'primaryColor': '#1a2540', 'primaryTextColor': '#ffffff', 'primaryBorderColor': '#ffffff', 'lineColor': '#ffffff', 'background': '#0a0f1e', 'mainBkg': '#1a2540', 'nodeBorder': '#ffffff', 'edgeLabelBackground': '#1a2540'}}}%%
graph TB
    subgraph OLD["Before: Dashboard-Centric"]
        U1["User"] --> D1["Open BI Tool"]
        D1 --> D2["Navigate to Report"]
        D2 --> D3["Set Filters"]
        D3 --> D4["Interpret Visual"]
        D4 --> D5["Form Conclusion"]
    end

    subgraph NEW["After: Governed Chat + Dashboards"]
        U2["User Question"] --> ROUTE{"Question Type?"}
        ROUTE -->|"Monitoring"| DASH["Dashboard\n(operational views)"]
        ROUTE -->|"Exploration"| CHAT["Chat Surface\n(Genie / Fabric Agent)"]
        CHAT --> SEM["Governed Semantics\n(metric views)"]
        DASH --> SEM
        SEM --> AUDIT["Audit Layer\n(BI team oversight)"]
    end

    style OLD fill:#1a2540,stroke:#ff6b6b,color:#ffffff
    style NEW fill:#1a2540,stroke:#00ff88,color:#ffffff
    style ROUTE fill:#1a2540,stroke:#ffb347,color:#ffffff
    style SEM fill:#1a2540,stroke:#00d4ff,color:#ffffff
    style AUDIT fill:#1a2540,stroke:#00d4ff,color:#ffffff
Implementation: What BI Teams Should Actually Do
This isn't a rip-and-replace. It's a role redesign. Here's what the transition looks like in practice.
Step 1: Map where questions actually go. Before changing anything, audit the real question flow. Where are users asking data questions today? Dashboard usage logs are easy. But also check: are people pasting data into ChatGPT? Are they asking questions in Slack channels? Are they emailing analysts with ad hoc requests that never touch a dashboard? This map reveals the bypass pattern already in motion.
Step 2: Build the semantic foundation first. Don't start with the chat interface. Start with the governed definitions. In Databricks, this means creating metric views in Unity Catalog -- versioned, documented metric definitions that any interface can consume. Revenue means one thing. Churn means one thing. The chat surface and the dashboard both pull from the same governed layer.
Step 3: Deploy chat for exploration, keep dashboards for monitoring. This is the process redesign, not automation. You're not automating the dashboard -- you're redesigning the exploration workflow. Dashboards stay for daily operational monitoring, KPI tracking, alerting. Chat surfaces (Genie spaces, Fabric data agents) handle the ad hoc questions that currently produce ad hoc analyst requests or, worse, go unanswered.
Step 4: Retool the BI team. The BI analyst who spent 60% of their time building report pages now spends 60% of their time on semantic governance: defining metrics, auditing agent-generated queries, reviewing edge cases where the natural language interpretation was ambiguous. This is higher-value work. It's also harder work, which is why it needs deliberate investment.
%%{init: {'theme': 'base', 'themeVariables': {'primaryColor': '#1a2540', 'primaryTextColor': '#ffffff', 'primaryBorderColor': '#ffffff', 'lineColor': '#ffffff', 'background': '#0a0f1e', 'mainBkg': '#1a2540', 'nodeBorder': '#ffffff', 'edgeLabelBackground': '#1a2540'}}}%%
graph LR
    subgraph BEFORE["BI Analyst Role: Before"]
        B1["Build Dashboards\n60%"] --- B2["Ad Hoc Requests\n25%"]
        B2 --- B3["Data Quality\n15%"]
    end

    subgraph AFTER["BI Analyst Role: After"]
        A1["Semantic Governance\n40%"] --- A2["Query Auditing\n25%"]
        A2 --- A3["Dashboard Maintenance\n20%"]
        A3 --- A4["Agent Tuning\n15%"]
    end

    BEFORE -->|"Process Redesign"| AFTER

    style BEFORE fill:#1a2540,stroke:#ff6b6b,color:#ffffff
    style AFTER fill:#1a2540,stroke:#00ff88,color:#ffffff
    style B1 fill:#1a2540,stroke:#ffb347,color:#ffffff
    style A1 fill:#1a2540,stroke:#00d4ff,color:#ffffff
Example: How Klarna's Shift Illustrates the Pattern
Klarna's AI journey is instructive here. The company replaced 700 customer service agents with AI -- then reversed course and started rehiring humans when they found that speed alone did not equal quality. The AI handled routine questions fast. But it lacked the governed context to handle ambiguous ones well.
Now apply this pattern to BI. Picture an insurance company whose claims analytics team has comprehensive Power BI dashboards -- loss ratios by product line, claims frequency trends, reserve adequacy views. Well-built, well-maintained. Then underwriters get access to a Fabric data agent connected to the same claims data. Within weeks, the majority of ad hoc claims questions -- "what's the average claim severity for commercial property in the Nordic region over the last 18 months?" -- flow through the agent instead of the dashboard. Dashboard usage for monitoring stays steady. But the exploration traffic vanishes.
The claims analytics team faces two choices: fight the shift or redesign their role. The smart move is redesign. Analysts move from dashboard development to semantic governance -- defining and versioning the metric layer that both the dashboards and the data agent consume. Someone becomes the agent auditor, reviewing the queries the natural language interface generates to catch misinterpretations before they reach underwriting decisions. The team may shrink, but the remaining team does higher-value work, and end users get answers in minutes instead of days. Klarna learned this the hard way: the AI interface is only as good as the governed meaning behind it.
Strategic Takeaway
BI tools aren't dying. The interface is diversifying. Dashboards hold their ground for monitoring, but exploration -- the messy, ad hoc, "I have a question right now" workflow -- is migrating to natural language surfaces backed by governed semantics. The BI team that clings to dashboard-building as its core identity will find itself bypassed. The one that pivots to semantic governance becomes the most critical team in the data stack -- because every chat surface, every agent, every automated decision depends on the definitions they maintain.
The cashiers who adapted to self-checkout became floor managers. The BI analysts who adapt to agentic interfaces become semantic governors. The interface changes. The judgment stays.
Sources
- Databricks Genie -- AI/BI -- Databricks documentation on Genie agent mode for natural language analytics
- Microsoft Fabric Data Agents -- Microsoft documentation on Fabric's data agent capabilities
- Databricks Metric Views (Unity Catalog) -- Governed metric definitions for LLM and agent consumption
Daniel Piatkowski Data & Analytics veteran shaping AI-native enterprises elicify.ai